| ☐ | Preliminary Proxy Statement |
| ☐ |
|
| ☒ | Definitive Proxy Statement |
| ☐ | Definitive Additional Materials |
| ☐ | Soliciting Material under §240.14a-12 |
| ☒ | No fee required. |
| ☐ | Fee paid previously with preliminary materials. |
| ☐ | Fee computed on table below per Exchange Act Rules 14a-6(i)(1) and0-11. |
| Sincerely, |
| /s/ Armen Panossian |
| Armen Panossian |
Chief Executive Officer |
4, 2024.
ocsl2024sm
ocsl2024sm.
| By order of the Board of Directors, |
| /s/ John B. Frank |
John B. Frank |
Chairman |
February 6, 2023
| Page | ||||
| 2 | ||||
| 2 | ||||
| 2 | ||||
| 2 | ||||
| 2 | ||||
| 2 | ||||
| 2 | ||||
| 3 | ||||
| 3 | ||||
| 3 | ||||
| 3 | ||||
| 3 | ||||
| 4 | ||||
| 4 | ||||
| 4 | ||||
| 4 | ||||
| 5 | ||||
| 15 | ||||
| 15 | ||||
| 15 | ||||
| 15 | ||||
| 16 | ||||
| 16 | ||||
| 16 | ||||
1
4, 2024.
Name | Number of Shares of Common Stock Owned Beneficially | Percentage of Common Stock Outstanding | ||||||
Interested Director: | ||||||||
John B. Frank (1) | 162,789 | * | ||||||
Independent Directors: | ||||||||
Phyllis R. Caldwell | 19,000 | * | ||||||
Deborah Gero | 59,736 | * | ||||||
Craig Jacobson | 170,273 | * | ||||||
Bruce Zimmerman | 57,390 | * | ||||||
Executive Officers: | ||||||||
Christopher McKown | 12,278 | * | ||||||
Ashley Pak | 2,600 | — | ||||||
Armen Panossian | 38,370 | * | ||||||
Mathew Pendo | 111,902 | * | ||||||
Matthew Stewart | 27,506 | * | ||||||
All Executive Officers and Directors as a Group (2) | 661,844 | * | ||||||
5% Holders | ||||||||
Leonard M. Tannenbaum and affiliates (3) | 11,210,533 | 6.1 | % | |||||
Oaktree Capital Management, L.P. and affiliates(4) | 16,225,044 | 8.8 | % | |||||
Name | Number of Shares of Common Stock Owned Beneficially | Percentage of Common Stock Outstanding | ||||||
Interested Director: | ||||||||
John B. Frank (1) | 54,261 | * | ||||||
Independent Directors: | ||||||||
Phyllis R. Caldwell | 9,166 | * | ||||||
Deborah Gero | 19,911 | * | ||||||
Craig Jacobson | 56,757 | * | ||||||
Bruce Zimmerman | 19,130 | * | ||||||
Executive Officers: | ||||||||
Christopher McKown | 5,655 | * | ||||||
Ashley Pak | 2,083 | — | ||||||
Armen Panossian | 12,789 | * | ||||||
Mathew Pendo | 41,698 | * | ||||||
Matthew Stewart | 10,781 | * | ||||||
All Executive Officers and Directors as a Group (2) | 232,231 | * | ||||||
| * | Represents less than 1% |
| (1) | Of the |
| (2) | Amount only includes Section 16(a) reporting persons of the Company. |
|
|
| Sales Price | Premium (Discount) of High Sales Price to NAV (2) | Premium (Discount) of Low Sales Price to NAV (2) | ||||||||||||||||||
| NAV (1) | High | Low | ||||||||||||||||||
Year ended September 30, 2020 | ||||||||||||||||||||
First quarter | $ | 19.82 | $ | 16.56 | $ | 15.00 | (16.4 | )% | (24.3 | )% | ||||||||||
Second quarter | $ | 16.01 | $ | 16.95 | $ | 6.99 | 5.9 | % | (56.3 | )% | ||||||||||
Third quarter | $ | 18.28 | $ | 14.70 | $ | 9.00 | (19.6 | )% | (50.8 | )% | ||||||||||
Fourth quarter | $ | 19.47 | $ | 15.69 | $ | 12.87 | (19.4 | )% | (33.9 | )% | ||||||||||
Year ended September 30, 2021 | ||||||||||||||||||||
First quarter | $ | 20.54 | $ | 16.98 | $ | 13.56 | (17.3 | )% | (34.0 | )% | ||||||||||
Second quarter | $ | 21.27 | $ | 19.08 | $ | 16.41 | (10.3 | )% | (22.8 | )% | ||||||||||
Third quarter | $ | 21.66 | $ | 20.76 | $ | 18.57 | (4.2 | )% | (14.3 | )% | ||||||||||
Fourth quarter | $ | 21.84 | $ | 22.20 | $ | 19.74 | 1.6 | % | (9.6 | )% | ||||||||||
Year ended September 30, 2022 | ||||||||||||||||||||
First quarter | $ | 22.03 | $ | 22.86 | $ | 21.09 | 3.8 | % | (4.3 | )% | ||||||||||
Second quarter | $ | 21.78 | $ | 23.43 | $ | 21.39 | 7.6 | % | (1.8 | )% | ||||||||||
Third quarter | $ | 20.67 | $ | 22.83 | $ | 18.60 | 10.4 | % | (10.0 | )% | ||||||||||
Fourth quarter | $ | 20.38 | $ | 21.75 | $ | 17.61 | 6.7 | % | (13.6 | )% | ||||||||||
Year ending September 30, 2023 | ||||||||||||||||||||
First quarter | * | $ | 21.69 | $ | 17.59 | * | * | |||||||||||||
Second quarter (through February 3, 2023) | * | $ | 21.48 | $ | 19.80 | * | * | |||||||||||||
Sales Price | Premium (Discount) of High Sales Price to NAV (2) | Premium (Discount) of Low Sales Price to NAV (2) | ||||||||||||||||||
NAV (1) | High | Low | ||||||||||||||||||
Year ended September 30, 2021 | ||||||||||||||||||||
First quarter | $ | 20.55 | $ | 16.98 | $ | 13.56 | (17.4 | )% | (34.0 | )% | ||||||||||
Second quarter | $ | 21.27 | $ | 19.08 | $ | 16.41 | (10.3 | )% | (22.8 | )% | ||||||||||
Third quarter | $ | 21.66 | $ | 20.76 | $ | 18.57 | (4.2 | )% | (14.3 | )% | ||||||||||
Fourth quarter | $ | 21.84 | $ | 22.20 | $ | 19.74 | 1.6 | % | (9.6 | )% | ||||||||||
Year ended September 30, 2022 | ||||||||||||||||||||
First quarter | $ | 22.03 | $ | 22.86 | $ | 21.09 | 3.8 | % | (4.3 | )% | ||||||||||
Second quarter | $ | 21.79 | $ | 23.43 | $ | 21.39 | 7.5 | % | (1.8 | )% | ||||||||||
Third quarter | $ | 20.67 | $ | 22.83 | $ | 18.60 | 10.4 | % | (10.0 | )% | ||||||||||
Fourth quarter | $ | 20.38 | $ | 21.75 | $ | 17.61 | 6.7 | % | (13.6 | )% | ||||||||||
Year ended September 30, 2023 | ||||||||||||||||||||
First quarter | $ | 19.63 | $ | 21.69 | $ | 17.58 | 10.5 | % | (10.4 | )% | ||||||||||
Second quarter | $ | 19.66 | $ | 21.48 | $ | 17.70 | 9.3 | % | (10.0 | )% | ||||||||||
Third quarter | $ | 19.58 | $ | 20.05 | $ | 17.99 | 2.4 | % | (8.1 | )% | ||||||||||
Fourth quarter | $ | 19.63 | $ | 20.71 | $ | 19.24 | 5.5 | % | (2.0 | )% | ||||||||||
Year ending September 30, 2024 | ||||||||||||||||||||
First quarter | * | $ | 20.79 | $ | 18.41 | * | * | |||||||||||||
Second quarter (through January 8, 2024) | * | $ | 21.12 | $ | 20.24 | * | * | |||||||||||||
* | Not determinable at the time of filing. |
| (1) | NAV per share is determined as of the last day in the relevant quarter and therefore may not reflect the NAV per share on the date of the high and low sales prices. The NAVs shown are based on outstanding shares at the end of each period. |
| (2) | Calculated as the respective high or low sales price less NAV per share, divided by NAV per share. |
| Prior to Sale Below NAV | Example 1 5% Offering at 5% Discount | Example 2 10% Offering at 10% Discount | Example 3 25% Offering at 25% Discount | Example 4 25% Offering at 100% Discount | ||||||||||||||||||||||||||||||||
| Following Sale | % Change | Following Sale | % Change | Following Sale | % Change | Following Sale | % Change | |||||||||||||||||||||||||||||
Offering Price | ||||||||||||||||||||||||||||||||||||
Price per share to public | — | $ | 10.00 | — | $ | 9.47 | — | $ | 7.89 | — | $ | 0.00 | — | |||||||||||||||||||||||
Net proceeds per share to issuer | — | $ | 9.50 | — | $ | 9.00 | — | $ | 7.50 | — | $ | 0.00 | — | |||||||||||||||||||||||
Decrease to NAV | ||||||||||||||||||||||||||||||||||||
Total shares outstanding | 1,000,000 | 1,050,000 | 5.00 | % | 1,100,000 | 10.00 | % | 1,250,000 | 25.00 | % | 1,250,000 | 25.00 | % | |||||||||||||||||||||||
NAV per share | $ | 10.00 | $ | 9.98 | (0.20) | % | $ | 9.91 | (0.90) | % | $ | 9.50 | (5.00) | % | $ | 8.00 | (20.00) | % | ||||||||||||||||||
| Prior to Sale Below NAV | Example 1 5% Offering at 5% Discount | Example 2 10% Offering at 10% Discount | Example 3 25% Offering at 25% Discount | Example 4 25% Offering at 100% Discount | ||||||||||||||||||||||||||||||||
| Following Sale | % Change | Following Sale | % Change | Following Sale | % Change | Following Sale | % Change | |||||||||||||||||||||||||||||
Dilution to Stockholder | ||||||||||||||||||||||||||||||||||||
Shares held by Stockholder A | 10,000 | 10,000 | — | 10,000 | — | 10,000 | — | 10,000 | — | |||||||||||||||||||||||||||
Percentage held by Stockholder A | 1.00 | % | 0.95 | % | (5.00) | % | 0.91 | % | (9.00) | % | 0.80 | % | (20.00) | % | 0.80 | % | (20.00) | % | ||||||||||||||||||
Total Asset Values | ||||||||||||||||||||||||||||||||||||
Total net asset value held by Stockholder A | $ | 100,000 | $ | 99,800 | (0.20) | % | $ | 99,100 | (0.90) | % | $ | 95,000 | (5.00) | % | $ | 80,000 | (20.00) | % | ||||||||||||||||||
Total investment by Stockholder A (assumed to be $10.00 per Share) | $ | 100,000 | $ | 100,000 | — | $ | 100,000 | — | $ | 100,000 | — | $ | 100,000 | — | ||||||||||||||||||||||
Total dilution to Stockholder A (total NAV less total investment) | — | $ | (200) | — | $ | (900) | — | $ | (5,000) | — | $ | (20,000) | — | |||||||||||||||||||||||
Per Share Amounts | ||||||||||||||||||||||||||||||||||||
NAV held by Stockholder A | — | $ | 9.98 | — | $ | 9.91 | — | $ | 9.50 | — | $ | 8.00 | — | |||||||||||||||||||||||
Investment per share held by Stockholder A (assumed to be $10.00 per share on shares held prior to sale) | $ | 10.00 | $ | 10.00 | — | $ | 10.00 | — | $ | 10.00 | — | $ | 10.00 | — | ||||||||||||||||||||||
Dilution per share held by Stockholder A (NAV less investment per share) | — | $ | (0.02) | — | $ | (0.09) | — | $ | (0.50) | — | $ | (2.00) | — | |||||||||||||||||||||||
Percentage dilution to Stockholder A (dilution per share divided by investment per share) | — | — | (0.20) | % | — | (0.90) | % | — | (5.00) | % | — | (20.00) | % | |||||||||||||||||||||||
Prior to Sale Below NAV | Example 1 5% Offering at 5% Discount | Example 2 10% Offering at 10% Discount | Example 3 25% Offering at 25% Discount | Example 4 25% Offering at 100% Discount | ||||||||||||||||||||||||||||||||
Following Sale | % Change | Following Sale | % Change | Following Sale | % Change | Following Sale | % Change | |||||||||||||||||||||||||||||
Offering Price | ||||||||||||||||||||||||||||||||||||
| Price per share to public | — | $ | 10.00 | — | $ | 9.47 | — | $ | 7.89 | — | $ | 0.00 | — | |||||||||||||||||||||||
| Net proceeds per share to issuer | — | $ | 9.50 | — | $ | 9.00 | — | $ | 7.50 | — | $ | 0.00 | — | |||||||||||||||||||||||
Decrease to NAV | ||||||||||||||||||||||||||||||||||||
| Total shares outstanding | 1,000,000 | 1,050,000 | 5.00 | % | 1,100,000 | 10.00 | % | 1,250,000 | 25.00 | % | 1,250,000 | 25.00 | % | |||||||||||||||||||||||
| NAV per share | $ | 10.00 | $ | 9.98 | (0.20 | )% | $ | 9.91 | (0.90 | )% | $ | 9.50 | (5.00 | )% | $ | 8.00 | (20.00 | )% | ||||||||||||||||||
Prior to Sale Below NAV | Example 1 5% Offering at 5% Discount | Example 2 10% Offering at 10% Discount | Example 3 25% Offering at 25% Discount | Example 4 25% Offering at 100% Discount | ||||||||||||||||||||||||||||||||
Following Sale | % Change | Following Sale | % Change | Following Sale | % Change | Following Sale | % Change | |||||||||||||||||||||||||||||
Dilution to Stockholder | ||||||||||||||||||||||||||||||||||||
| Shares held by Stockholder A | 10,000 | 10,000 | — | 10,000 | — | 10,000 | — | 10,000 | — | |||||||||||||||||||||||||||
| Percentage held by Stockholder A | 1.00 | % | 0.95 | % | (5.00 | )% | 0.91 | % | (9.00 | )% | 0.80 | % | (20.00 | )% | 0.80 | % | (20.00 | )% | ||||||||||||||||||
Total Asset Values | ||||||||||||||||||||||||||||||||||||
| Total net asset value held by Stockholder A | $ | 100,000 | $ | 99,800 | (0.20 | )% | $ | 99,100 | (0.90 | )% | $ | 95,000 | (5.00 | )% | $ | 80,000 | (20.00 | )% | ||||||||||||||||||
| Total investment by Stockholder A (assumed to be $10.00 per Share) | $ | 100,000 | $ | 100,000 | — | $ | 100,000 | — | $ | 100,000 | — | $ | 100,000 | — | ||||||||||||||||||||||
| Total dilution to Stockholder A (total NAV less total investment) | — | $ | (200 | ) | — | $ | (900 | ) | — | $ | (5,000 | ) | — | $ | (20,000 | ) | — | |||||||||||||||||||
Per Share Amounts | ||||||||||||||||||||||||||||||||||||
| NAV held by Stockholder A | — | $ | 9.98 | — | $ | 9.91 | — | $ | 9.50 | — | $ | 8.00 | — | |||||||||||||||||||||||
| Investment per share held by Stockholder A (assumed to be $10.00 per share on shares held prior to sale) | $ | 10.00 | $ | 10.00 | — | $ | 10.00 | — | $ | 10.00 | — | $ | 10.00 | — | ||||||||||||||||||||||
| Dilution per share held by Stockholder A (NAV less investment per share) | — | $ | (0.02 | ) | — | $ | (0.09 | ) | — | $ | (0.50 | ) | — | $ | (2.00 | ) | — | |||||||||||||||||||
| Percentage dilution to Stockholder A (dilution per share divided by investment per share) | — | — | (0.20 | )% | — | (0.90 | )% | — | (5.00 | )% | — | (20.00 | )% | |||||||||||||||||||||||
These stockholders may also experience a decline in the market price of their shares, which often reflects to some degree announced or potential decreases in NAV. This decrease could be more pronounced as the size of the offering and level of discounts increases.
Prior to Sale Below NAV | 50% Participation | 150% Participation | ||||||||||||||||||
Following Sale | % Change | Following Sale | % Change | |||||||||||||||||
Offering Price | ||||||||||||||||||||
| Price per share to public | — | $ | 7.89 | — | $ | 7.89 | — | |||||||||||||
| Net proceeds per share to issuer | — | $ | 7.50 | — | $ | 7.50 | — | |||||||||||||
Increases in Shares and Decrease to NAV | ||||||||||||||||||||
| Total shares outstanding | 1,000,000 | 1,250,000 | 25.00 | % | 1,250,000 | 25.00 | % | |||||||||||||
| NAV per share | $ | 10.00 | $ | 9.50 | (5.00 | )% | $ | 9.50 | (5.00 | )% | ||||||||||
(Dilution)/Accretion to Participating Stockholder A | ||||||||||||||||||||
| Shares held by Stockholder A | 10,000 | 11,250 | 12.50 | % | 13,750 | 37.50 | % | |||||||||||||
| Percentage held by Stockholder A | 1.00 | % | 0.90 | % | (10.00 | )% | 1.10 | % | 10.00 | % | ||||||||||
Total Asset Values | ||||||||||||||||||||
| Total NAV held by Stockholder A | $ | 100,000 | $ | 106,875 | 6.88 | % | $ | 130,625 | 30.63 | % | ||||||||||
| Total investment by Stockholder A (assumed to be $10.00 per share on shares held prior to sale) | $ | 100,000 | $ | 109,863 | 9.86 | % | $ | 129,588 | 29.59 | % | ||||||||||
| Total (dilution)/accretion to Stockholder A (total NAV less total investment) | — | $ | (2,988 | ) | — | $ | 1,037 | — | ||||||||||||
Per Share Amounts | ||||||||||||||||||||
| NAV held by Stockholder A | — | $ | 9.50 | — | $ | 9.50 | — | |||||||||||||
| Investment per share held by Stockholder A (assumed to be $10.00 per share on shares held prior to sale) | $ | 10.00 | $ | 9.77 | (2.30 | )% | $ | 9.42 | (5.80 | )% | ||||||||||
| (Dilution)/accretion per share held by Stockholder A (NAV less investment per share) | — | $ | (0.27 | ) | — | $ | 0.08 | — | ||||||||||||
| Percentage (dilution)/accretion to Stockholder A (dilution/accretion per share divided by investment per share) | — | — | (2.76 | )% | — | 0.85 | % | |||||||||||||
earnings and assets and their voting power than the Company’s increase in assets, potential earning power and voting interests due to such offering. These investors will, however, be subject to the risk that the Company may make additional discounted offerings in which such new stockholder does not participate, in which case such new stockholder will experience dilution as described above in such subsequent offerings. These investors may also experience a decline in the market price of their shares, which often reflects to some degree announced or potential decreases in NAV. This decrease could be more pronounced as the size of the offering and level of discounts increases.
| Example 1 5% Offering at 5% Discount | Example 2 10% Offering at 10% Discount | Example 3 25% Offering at 25% Discount | Example 4 25% Offering at 100% Discount | |||||||||||||||||||||||||||||||||
| Prior to Sale Below NAV | Following Sale | % Change | Following Sale | % Change | Following Sale | % Change | Following Sale | % Change | ||||||||||||||||||||||||||||
Offering Price | ||||||||||||||||||||||||||||||||||||
Price per share to public | — | $ | 10.00 | — | $ | 9.47 | — | $ | 7.89 | — | $ | 0.00 | — | |||||||||||||||||||||||
Net offering proceeds per share to issuer | — | $ | 9.50 | — | $ | 9.00 | — | $ | 7.50 | — | $ | 0.00 | — | |||||||||||||||||||||||
Decrease to NAV | ||||||||||||||||||||||||||||||||||||
Total shares outstanding | 1,000,000 | 1,050,000 | 5.00 | % | 1,100,000 | 10.00 | % | 1,250,000 | 25.00 | % | 1,250,000 | 25.00 | % | |||||||||||||||||||||||
NAV per share | 10.00 | $ | 9.98 | (0.20 | )% | $ | 9.91 | (0.90 | )% | $ | 9.50 | (5.00 | )% | $ | 8.00 | (20.00 | )% | |||||||||||||||||||
Dilution to Stockholder A | ||||||||||||||||||||||||||||||||||||
Shares held by Stockholder A | — | 500 | — | 1,000 | — | 2,500 | — | 2,500 | — | |||||||||||||||||||||||||||
Percentage held by Stockholder A | — | 0.05 | % | — | 0.09 | % | — | 0.20 | % | — | 0.20 | % | — | |||||||||||||||||||||||
Total Asset Values | ||||||||||||||||||||||||||||||||||||
Total NAV held by Stockholder A | — | $ | 4,990 | — | $ | 9,910 | — | $ | 23,750 | — | $ | 20,000 | — | |||||||||||||||||||||||
Total investment by Stockholder A | — | $ | 5,000 | — | $ | 9,470 | — | $ | 19,725 | — | $ | 0.00 | — | |||||||||||||||||||||||
Total (dilution)/accretion to Stockholder A (total NAV less total investment) | — | $ | (10 | ) | — | $ | 440 | — | $ | 4,025 | — | $ | 20,000 | — | ||||||||||||||||||||||
| Example 1 5% Offering at 5% Discount | Example 2 10% Offering at 10% Discount | Example 3 25% Offering at 25% Discount | Example 4 25% Offering at 100% Discount | |||||||||||||||||||||||||||||||||
| Prior to Sale Below NAV | Following Sale | % Change | Following Sale | % Change | Following Sale | % Change | Following Sale | % Change | ||||||||||||||||||||||||||||
Per Share Amounts | ||||||||||||||||||||||||||||||||||||
NAV held by Stockholder A | — | $ | 9.98 | — | $ | 9.91 | — | $ | 9.50 | — | $ | 8.00 | — | |||||||||||||||||||||||
Investment per share held by Stockholder A | — | $ | 10.00 | — | $ | 9.47 | — | $ | 7.89 | — | $ | 0.00 | — | |||||||||||||||||||||||
(Dilution)/accretion per share held by Stockholder A (NAV less investment per share) | — | $ | (0.02 | ) | — | $ | 0.44 | — | $ | 1.61 | — | $ | 8.00 | — | ||||||||||||||||||||||
Percentage (dilution)/accretion to Stockholder A ((dilution)/accretion per share divided by investment per share) | — | — | (0.20 | )% | — | 4.65 | % | — | 20.41 | % | — | |||||||||||||||||||||||||
Example 1 5% Offering at 5% Discount | Example 2 10% Offering at 10% Discount | Example 3 25% Offering at 25% Discount | Example 4 25% Offering at 100% Discount | |||||||||||||||||||||||||||||||||
Prior to Sale Below NAV | Following Sale | % Change | Following Sale | % Change | Following Sale | % Change | Following Sale | % Change | ||||||||||||||||||||||||||||
Offering Price | ||||||||||||||||||||||||||||||||||||
| Price per share to public | — | $ | 10.00 | — | $ | 9.47 | — | $ | 7.89 | — | $ | 0.00 | — | |||||||||||||||||||||||
| Net offering proceeds per share to issuer | — | $ | 9.50 | — | $ | 9.00 | — | $ | 7.50 | — | $ | 0.00 | — | |||||||||||||||||||||||
Decrease to NAV | ||||||||||||||||||||||||||||||||||||
| Total shares outstanding | 1,000,000 | 1,050,000 | 5.00 | % | 1,100,000 | 10.00 | % | 1,250,000 | 25.00 | % | 1,250,000 | 25.00 | % | |||||||||||||||||||||||
| NAV per share | 10.00 | $ | 9.98 | (0.20 | )% | $ | 9.91 | (0.90 | )% | $ | 9.50 | (5.00 | )% | $ | 8.00 | (20.00 | )% | |||||||||||||||||||
Dilution to Stockholder A | ||||||||||||||||||||||||||||||||||||
| Shares held by Stockholder A | — | 500 | — | 1,000 | — | 2,500 | — | 2,500 | — | |||||||||||||||||||||||||||
| Percentage held by Stockholder A | — | 0.05 | % | — | 0.09 | % | — | 0.20 | % | — | 0.20 | % | — | |||||||||||||||||||||||
Total Asset Values | ||||||||||||||||||||||||||||||||||||
| Total NAV held by Stockholder A | — | $ | 4,990 | — | $ | 9,910 | — | $ | 23,750 | — | $ | 20,000 | — | |||||||||||||||||||||||
| Total investment by Stockholder A | — | $ | 5,000 | — | $ | 9,470 | — | $ | 19,725 | — | $ | 0.00 | — | |||||||||||||||||||||||
| Total (dilution)/accretion to Stockholder A (total NAV less total investment) | — | $ | (10 | ) | — | $ | 440 | — | $ | 4,025 | — | $ | 20,000 | — | ||||||||||||||||||||||
Example 1 5% Offering at 5% Discount | Example 2 10% Offering at 10% Discount | Example 3 25% Offering at 25% Discount | Example 4 25% Offering at 100% Discount | |||||||||||||||||||||||||||||||||
Prior to Sale Below NAV | Following Sale | % Change | Following Sale | % Change | Following Sale | % Change | Following Sale | % Change | ||||||||||||||||||||||||||||
Per Share Amounts | ||||||||||||||||||||||||||||||||||||
| NAV held by Stockholder A | — | $ | 9.98 | — | $ | 9.91 | — | $ | 9.50 | — | $ | 8.00 | — | |||||||||||||||||||||||
| Investment per share held by Stockholder A | — | $ | 10.00 | — | $ | 9.47 | — | $ | 7.89 | — | $ | 0.00 | — | |||||||||||||||||||||||
| (Dilution)/accretion per share held by Stockholder A (NAV less investment per share) | — | $ | (0.02 | ) | — | $ | 0.44 | — | $ | 1.61 | — | $ | 8.00 | — | ||||||||||||||||||||||
| Percentage (dilution)/accretion to Stockholder A ((dilution)/accretion per share divided by investment per share) | — | — | (0.20 | )% | — | 4.65 | % | — | 20.41 | % | — | |||||||||||||||||||||||||
Stockholders should also consider that they will have no subscription, preferential or preemptive rights to additional shares of the common stock proposed to be authorized for issuance pursuant to the Proposal, and thus any future issuance of common stock at a price below NAV per share will dilute such stockholders’ holdings of common stock as a percentage of shares outstanding to the extent such stockholders do not purchase sufficient shares of common stock in the offering or otherwise to maintain their percentage interest. Further, if current stockholders of the Company do not purchase any shares of common stock to maintain their percentage interest, regardless of whether such offering is above or below the then current NAV per share, their voting power will be diluted.
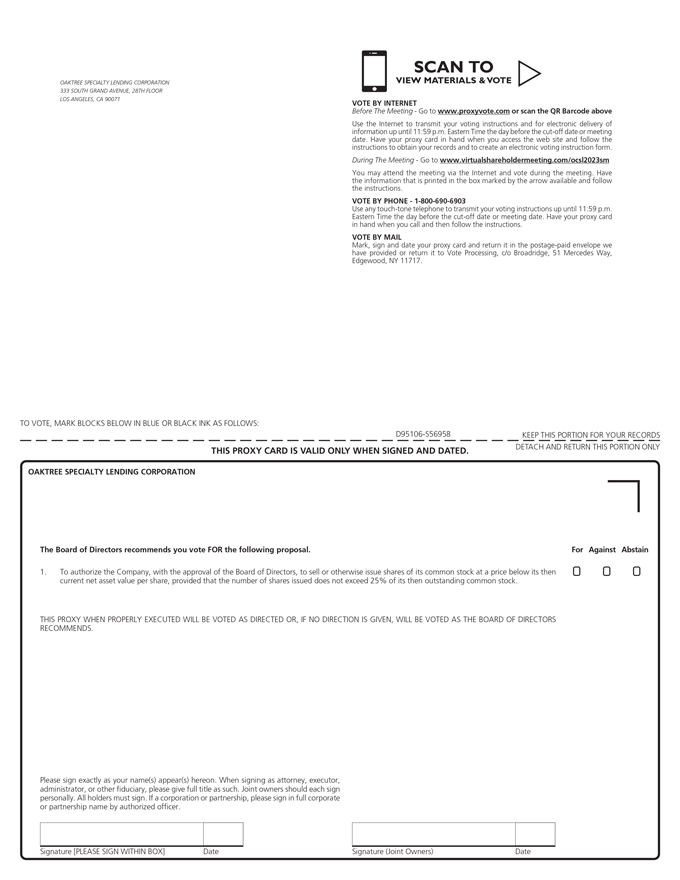
OAKTREE SPECIALTY LENDING CORPORATION 333 SOUTH GRAND AVENUE, 28TH FLOOR LOS ANGELES, CA 90071 SCAN TO VIEW MATERIALS & VOTE w VOTE BY INTERNET Before The Meeting—Go to www.proxyvote.com or scan the QR Barcode above Use the Internet to transmit your voting instructions and for electronic delivery
OAKTREE SPECIALTY LENDING CORPORATION 333 SOUTH GRAND AVENUE, 28TH FLOOR LOS ANGELES, CA 90071 |  | |
VOTE BY INTERNET | ||
Before The Meeting www.proxyvote.com or scan the QR Barcode above | ||
| Use the Internet to transmit your voting instructions and for electronic delivery of information up until 11:59 p.m. Eastern Time the day before the cut-off date or meeting date. Have your proxy card in hand when you access the web site and follow the instructions to obtain your records and to create an electronic voting instruction form. | ||
During The Meeting www.virtualshareholdermeeting.com/ocsl2024sm | ||
| You may attend the meeting via the Internet and vote during the meeting. Have the information that is printed in the box marked by the arrow available and follow the instructions. | ||
VOTE BY PHONE - 1-800-690-6903 | ||
| Use any touch-tone telephone to transmit your voting instructions up until 11:59 p.m. Eastern Time the day before the cut-off date or meeting date. Have your proxy card in hand when you call and then follow the instructions. | ||
VOTE BY MAIL | ||
| Mark, sign and date your proxy card and return it in the postage-paid envelope we have provided or return it to Vote Processing, c/o Broadridge, 51 Mercedes Way, Edgewood, NY 11717. | ||
| TO VOTE, MARK BLOCKS BELOW IN BLUE OR BLACK INK AS FOLLOWS: | ||||
| V27361-S77915 | KEEP THIS PORTION FOR YOUR RECORDS | |||
| DETACH AND RETURN THIS PORTION ONLY | ||||
THIS PROXY CARD IS VALID ONLY WHEN SIGNED AND DATED. | ||||
OAKTREE SPECIALTY LENDING CORPORATION | ||||||||||||||
The Board of Directors recommends you vote FOR the following proposal. | For | Against | Abstain | |||||||||||
| 1. To authorize the Company, with the approval of the Board of Directors, to sell or otherwise issue shares of its common stock at a price below its then current net asset value per share, provided that the number of shares issued does not exceed 25% of its then outstanding common stock. | ☐ | ☐ | ☐ | |||||||||||
| THIS PROXY WHEN PROPERLY EXECUTED WILL BE VOTED AS DIRECTED OR, IF NO DIRECTION IS GIVEN, WILL BE VOTED AS THE BOARD OF DIRECTORS RECOMMENDS. | ||||||||||||||
| Please sign exactly as your name(s) appear(s) hereon. When signing as attorney, executor, administrator, or other fiduciary, please give full title as such. Joint owners should each sign personally. All holders must sign. If a corporation or partnership, please sign in full corporate or partnership name by authorized officer. | ||||||||||||||
| Signature [PLEASE SIGN WITHIN BOX] | Date | Signature (Joint Owners) | Date |
17, 2023. 4, 2024. D95107-S56958 Oaktree Specialty Lending Corporation SPECIAL MEETING OF STOCKHOLDERS March 17, 2023 10:00 a.m. Pacific Time (1:00 p.m. Eastern Time) This proxy is solicited by the Board of Directors The undersigned hereby appoints Armen Panossian, Mathew Pendo and Mary Gallegly, and each of them, and each with full power of substitution, to act as attorneys and proxies for the undersigned to vote all the shares of common stock of Oaktree Specialty Lending Corporation (the “Company”) which the undersigned is entitled to vote at the 2023 Special Meeting of Stockholders of the Company, to be held virtually on March 17, 2023, at 10:00 a.m. Pacific Time (1:00 p.m. Eastern Time), at the following website: www.virtualshareholdermeeting.com/ocsl2023sm, and any adjournments or postponements thereof, as indicated on this proxy. The undersigned acknowledges receipt of the Notice of Special Meeting of Stockholders of the Company. THIS PROXY IS REVOCABLE AND WILL BE VOTED AS DIRECTED BY THE UNDERSIGNED ON THE REVERSE SIDE. WHERE NO CHOICE IS SPECIFIED, VOTES ENTITLED TO BE CAST BY THE UNDERSIGNED WILL BE CAST FOR PROPOSAL 1, AS DESCRIBED IN THE PROXY STATEMENT. THE VOTES ENTITLED TO BE CAST BY THE UNDERSIGNED WILL BE CAST IN THE DISCRETION OF THE PROXY HOLDER ON ANY OTHER MATTER THAT MAY PROPERLY COME BEFORE THE MEETING. Continued and to be signed on reverse side